As communities move to reopen after COVID-19 closures, leaders at all levels of government and business can use geospatial technology to help monitor and safeguard public health. Building on response efforts—where geographic information system (GIS) technology supported clear steps to take action—the same capabilities can guide safe reopening strategies.
Following are five recommended spatial approaches to reopening.
1. Map the Trends
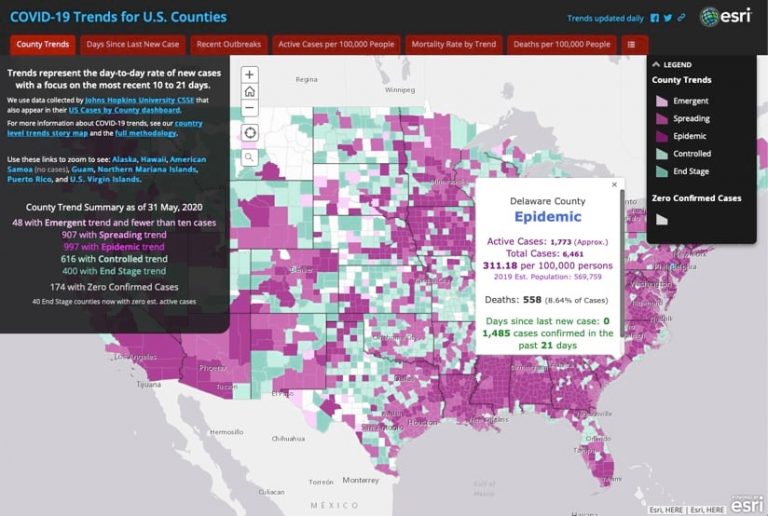
Of utmost concern is the ability to stay vigilant and quell future waves of cases. The well-documented 1918 flu pandemic was deadliest during its second wave of infections. Today, we’re far more aware and connected, with maps that show up-to-date, time-enabled information for monitoring case-per-day trends.
Maps provide an at-a-glance understanding of many key aspects of the COVID-19 crisis. They empower us to see if cases are spreading and spiking, and when to determine whether the outbreak is controlled. As we’ve witnessed around the world, large regions appear to be be doing well while individual communities may be suffering from continuing spread. Maps help identify local hotspots to provide focused services for people in need and to contain outbreaks. As the crisis evolves, we gain a more granular view of the spread of cases, such as the State of Maryland’s view of cases by ZIP Code.
Epidemiologists and local health authorities now have a greater appreciation of the power of spatial analytics and maps for a data-driven response. They are using models for projections of case increases, mapped against scenarios with differing levels of social distancing compliance, and using that insight to plan for added hospital capacity in the event of a surge.
2. Map for Community Resilience
Many anticipate changes in the ways we live our public lives, both short and long term. The COVID-19 pandemic has revealed the critical impacts of human interactions. Consequently, information about where people are and how they are interacting is essential to the ongoing safety and security of our communities.
To maintain community resilience, leaders can use the geospatial toolset to monitor how people interact and move, then make data-driven decisions to support population needs and safety for each location.
As part of a disease surveillance platform, GIS enables advanced location analytics for detecting patterns in real time, spotting anomalies, and gaining insights. For example, contact tracing can help leaders quell the spread of disease by understanding linkages beyond cases and contacts to include the places people have visited—a new effort called community contact tracing.
As people take part in social and cultural activities again, GIS tools can assist in the planning and managing of physical distancing so new transmission chains are not initiated. If cases begin to increase again, GIS can be useful in monitoring human mobility data, looking for areas of concern among anonymized data points from mobile devices.
By monitoring demand for government services by location, leaders can prioritize areas where more support may be needed. This is especially true for monitoring health system capacity which should be regularly assessed as people return to the workplace and venture into their communities. In this way, we can be ready to take action quickly if cases are forecasted to overwhelm capacity.
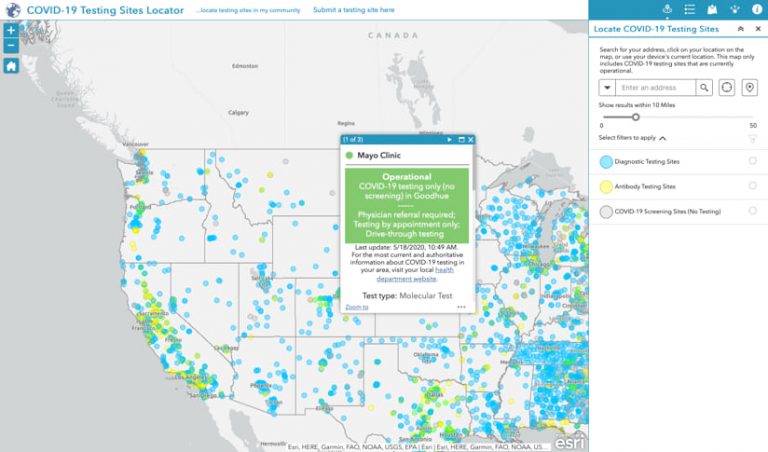
GIS map-based directories offer a simple, intuitive way to connect residents to government services, health services, and businesses—and these resource locators have never been more important. Municipalities around the world have used a similar approach to creating map-based directories for food distribution sites, grocery store inventories, essential business directories, and more.
If we are to ensure a truly resilient community, we must analyze service delivery to uncover disparities and adjust to provide equitable care for all.
3. Map for Organizational Resilience
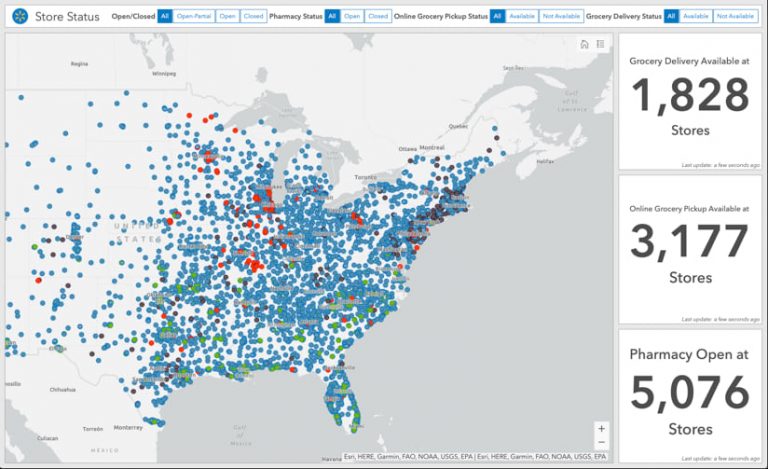
COVID-19 crisis-related disruptions have hit businesses particularly hard. GIS provides business leaders with operational awareness to help stabilize and reestablish after cases are controlled. Businesses with many physical locations use GIS to monitor the status of facilities and retail outlets. They use GIS dashboards to see individual performance, compile and react to differing infection rates and regulations in all locations, and make strategic reopening plans. GIS is also used to monitor complex global supply chains, many of which have been disrupted by global factory closures.
Many businesses are using online maps to assess and display staff safety and wellness for employees deemed essential, and those working from home or in the field. Map-based awareness allows businesses to visualize personnel resources and to relocate staff based on current needs and conditions.
As business leaders contemplate the return of their workforce to office locations, they can use indoor mapping to addresses space utilization and factor in social distancing. An indoor view is also helping companies prepare and respond should an employee become infected—giving managers the information they need to warn and quarantine others who may have come in contact. A real-time map of indoor spaces allows a business to monitor sanitization operations and react to any safety concerns.
4. Map the Impacts
Map-based applications and dashboards help leaders quickly assess impacts of the COVID-19 crisis. With unemployment spiking, a popular map displays the economic vulnerability of locations across the US. Leaders from business and government are working to understand the impact on revenues and budgets in order to respond and plan.
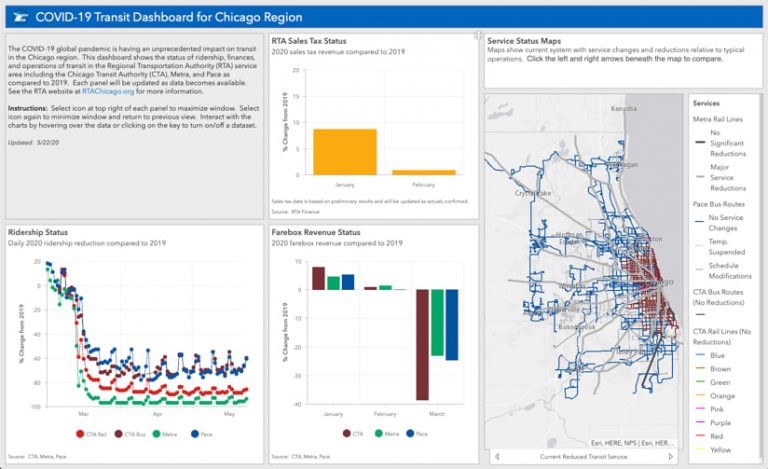
As businesses and governments work toward economic reactivation, it will be important to monitor both economic and health indicators. Organizations can tap into available COVID-19 case data from local, state, and federal authorities to see changes in case levels and create alerts if any locations face increasing risk. Local governments look to these same economic and health indicators to balance community wellness with economic reactivation. For business and government leaders, GIS maps and dashboards are informing decisions about relaxing or strengthening social distancing measures.
5. Communicate with Maps
While national policy certainly plays a role in how locations recover from the COVID-19 crisis, most actions take place at the local level. It’s here that policies and resulting behaviors have the most impact. Local governments have created multiple map-based apps to address different facets of this crisis, and they use the community engagement tool, ArcGIS Hub, to organize and display this information.
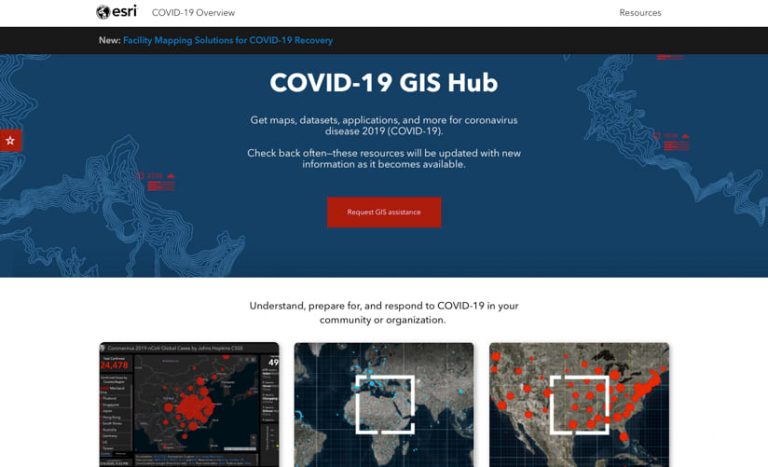
Esri used this same tool to create the COVID-19 GIS Hub which compiles resources and tools that support GIS users around the world as they understand, prepare, and respond. A combination of map-based communication tools—interactive web maps, dashboard apps, and story maps—help organizations rapidly relate constantly changing situations.
Communities are taking a data and map-centric approach to this first pandemic in the digital age. Never before have we seen such a global hunger for real-time or near real-time information. Governments and businesses are also highly engaged—analyzing and conveying details that help constituents, residents, and customers understand local impact. Because ArcGIS is a flexible platform, it allows people to tailor messaging and resources to unique circumstances.
As jurisdictions work to meet health benchmarks and prepare to reopen, the map-based view will continue to help. Organizations at all scales will use GIS to map, measure, model, and monitor reopening during the COVID-19 crisis. A focused awareness of the power of geographic thinking will be essential to keeping communities safe and healthy.
This post originally appeared in the Esri Blog.


